![]()
Understanding:
• Phases shown in the sigmoid curve can be explained by rates of natality, mortality, immigration and emigration
Stable populations occupying a fixed geographic space demonstrate a sigmoidal (S-shaped) population growth curve
- This curve will typically follow three key stages – an exponential growth phase, a transitional phase and a plateau phase
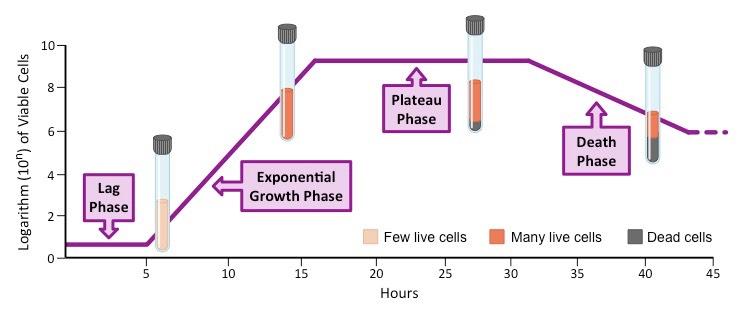
Exponential Growth Phase
- Initially, population growth will be slow (lag period) as there are few reproductive individuals that are likely widely dispersed
- As numbers accumulate, there is a rapid increase in population size as natality greatly exceeds mortality
- Mortality is low because there are abundant resources and minimal environmental resistance
Transitional Phase
- As the population continues to grow, resources eventually become limited, which leads to competition for survival
- Natality rates start to fall and mortality rates begin to rise, leading to a slowing of population growth
Plateau Phase
- Eventually the increasing mortality rate equals the natality rate and population growth becomes static
- The population has reached the carrying capacity (κ) of the environment, with limiting factors keeping the population stable
- The population size at this point will not be constant, but will oscillate around the carrying capacity to remain even
Sigmoid Population Growth Curve

The stages of the sigmoidal population growth curve can be summarised as follows:
- Exponential Growth Phase: N + I >>> M + E (much greater than)
- Transitional Phase: N + I > M + E (greater than)
- Plateau Phase: N + I = M + E (equal)
![]()
Skill:
• Modelling the growth curve using a simple organism such as yeast or a species of Lemna
Population growth curves can be modelled using simple organisms such as yeast or duckweed (Lemna)
- These organisms can be grown on agar plates (yeast) or in cups of water (duckweed)
There are many benefits to using simple organisms like yeast and duckweed to model population growth:
- These organisms are small and so can easily populate small containers that are easy to store
- Nutritional requirements are low, making experiments inexpensive to conduct
- These organisms reproduce very rapidly, allowing results to be generated in a relatively short period of time
Yeast and Duckweed

When grown in controlled conditions, these simple organisms will demonstrate the phases of a sigmoidal growth curve:
- After an initial lag period, there will be a period of exponential growth whilst resources remain abundant
- As resources become limited, the growth rate may begin to slow before eventually becoming stationary (plateau)
- Because organisms are being grown in closed systems, an accumulation of metabolic waste will inevitably occur
- This will eventually lead to an increase in the rate of death and an overall reduction in population size
Modelling Population Growth