
![]()
Skill:
• Use of a transect to correlate the distribution of plant or animal species with an abiotic variable
Quadrats and transects can measure the distribution of a plant or animal species in response to an incremental abiotic factor
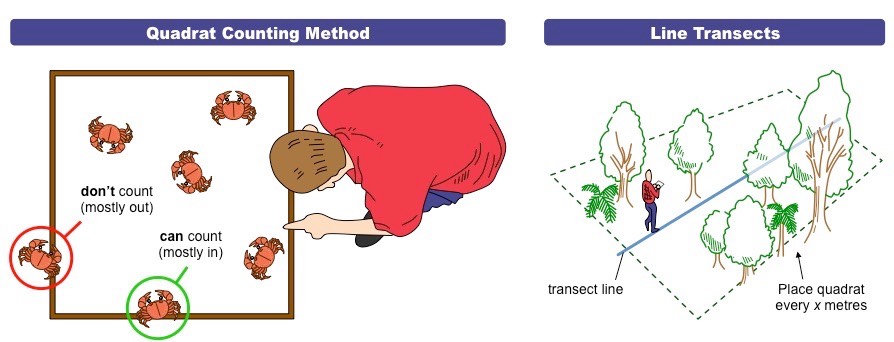
- Quadrats are rectangular frames of known dimensions that can be used to establish population densities
- Transects are a straight line along an abiotic gradient from which population data can be recorded to determine a pattern
Quadrats can be placed at regular intervals along the transect line in order to generate population data
- The quadrats will show the changing distribution pattern of a species in response to a change in an abiotic variable
- This data can be used to identify optimal conditions as well as zones of stress and zones of intolerance
Sampling with Quadrats and Transects
Transect Data
Transects are used to assess species distribution in correlation with any abiotic factor that varies across a measurable distance
- These factors could include elevation, elemental exposure, temperature, light levels, pH, humidity and more
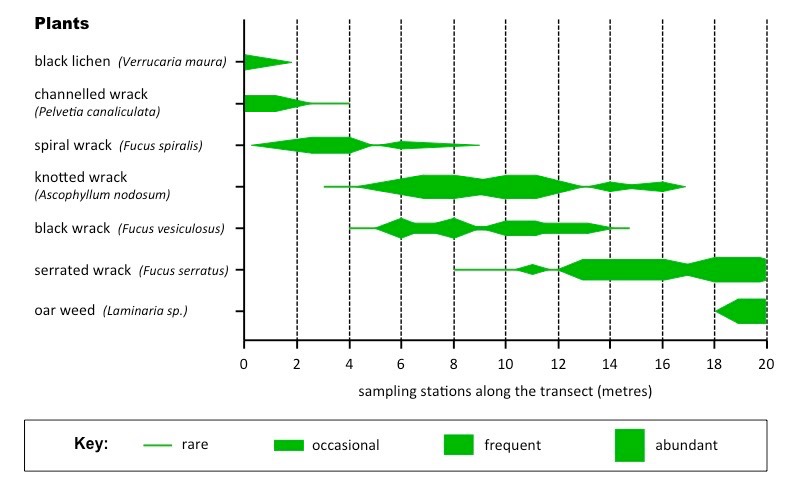
A kite graph can be used to represent changes in species distribution in a clear and effective fashion
- The relative width of each ‘kite’ represents the abundance of an organism at a particular point along a transect
In the example below, animal and plant distribution patterns are determined along a typical rocky shore
- Organisms experience varying levels of environmental exposure at high tide regions and low tide regions
Distribution Along a Rocky Shore
 Transect Data:
Plant Distribution Animal Distribution Elevation
Transect Data:
Plant Distribution Animal Distribution Elevation